/
Graph Views
Graph Views
- Mehreen Rahman
- Kat Mareck (Deactivated)
Owned by Mehreen Rahman
Last updated: Oct 09, 2018 by Kat Mareck (Deactivated)
Description
The Graph view of quickstats summaries show a visual representation of performance, financial, and quality metrics for your SpringServe objects. In each section, sunburst graph is displayed for given metrics. Sunburst graphs give you a hierarchical view of data.
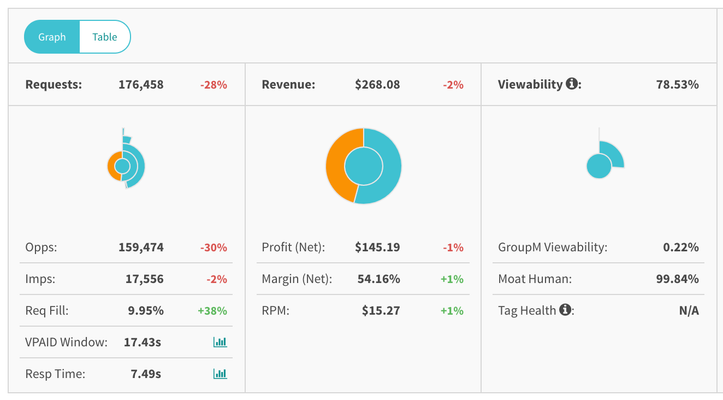
When hovering over a segment you will see a label with the metric and corresponding rate. For example, hovering over the impressions segment shows the number of impressions, the request fill, and the opportunity fill, along with their respective range comparisons. Clicking a segment in the graph allows you to drill down to that level. Click the backwards arrow button to move up a level.
Performance:
| Supply | Demand |
|---|---|
| Total Requests | Ad Requests |
| Usable Requests & Total Blocked Requests | Opportunities |
| Opportunities & Missed Opportunities | Impressions |
| Impressions | Completes |
| Player Loads | |
| Completes |
Note that Opportunities will not appear for VPAID none activity
Financials:
- Level 1: Revenue
- Level 2: Cost & Profit
Quality
- Level 1: Viewability
- Level 2: VOC
- Level 3: AVOC
, multiple selections available,
Related content
User Segments
User Segments
More like this
Partner Segments
Partner Segments
More like this
Performance Based Video Advertising
Performance Based Video Advertising
Read with this
Auto Optimization
Auto Optimization
More like this
Supply
Read with this
Demand
More like this