Bidder Account Overview
Overview:
The Account Activity dashboard is where you can get a broad view of your performance buying from publishers in SpringServe.
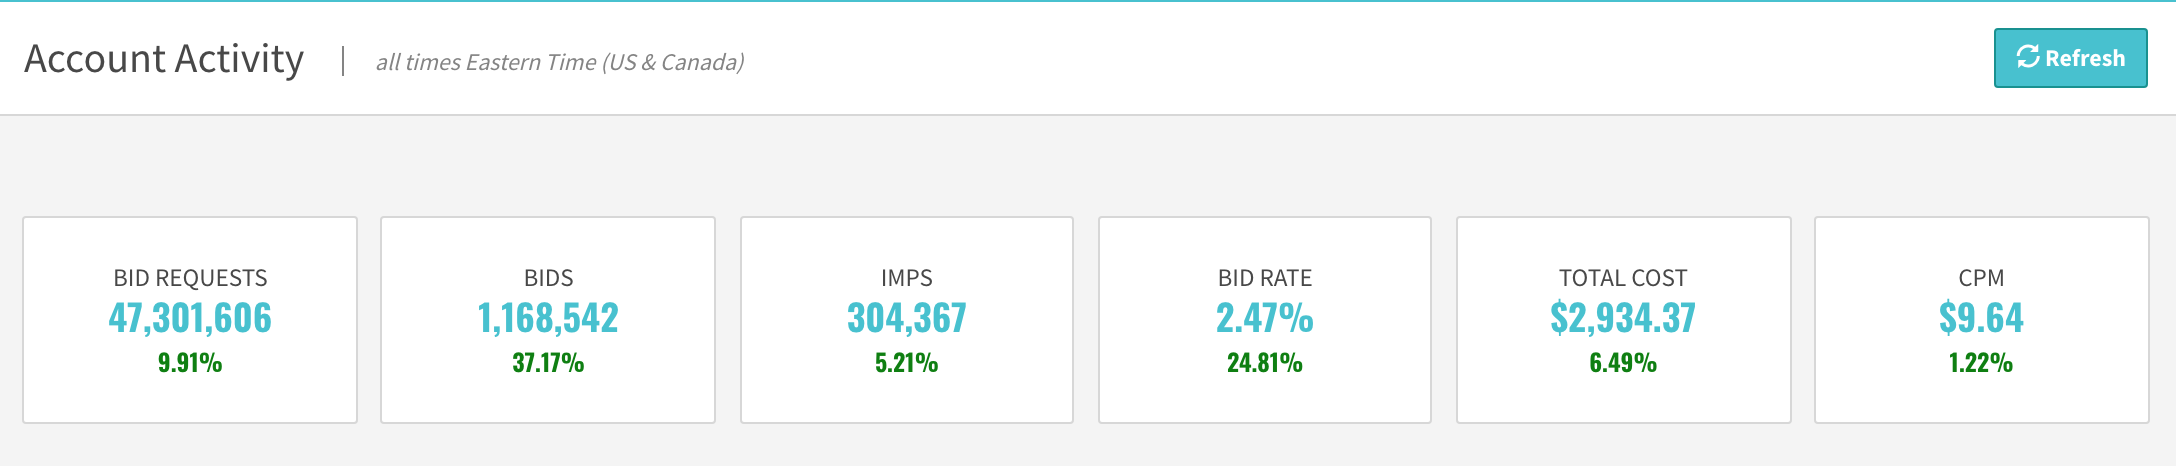
Tiles:
The Account Summary Tiles show metrics for today for your entire buying on SpringServe – both Deal ID's and Open Market.
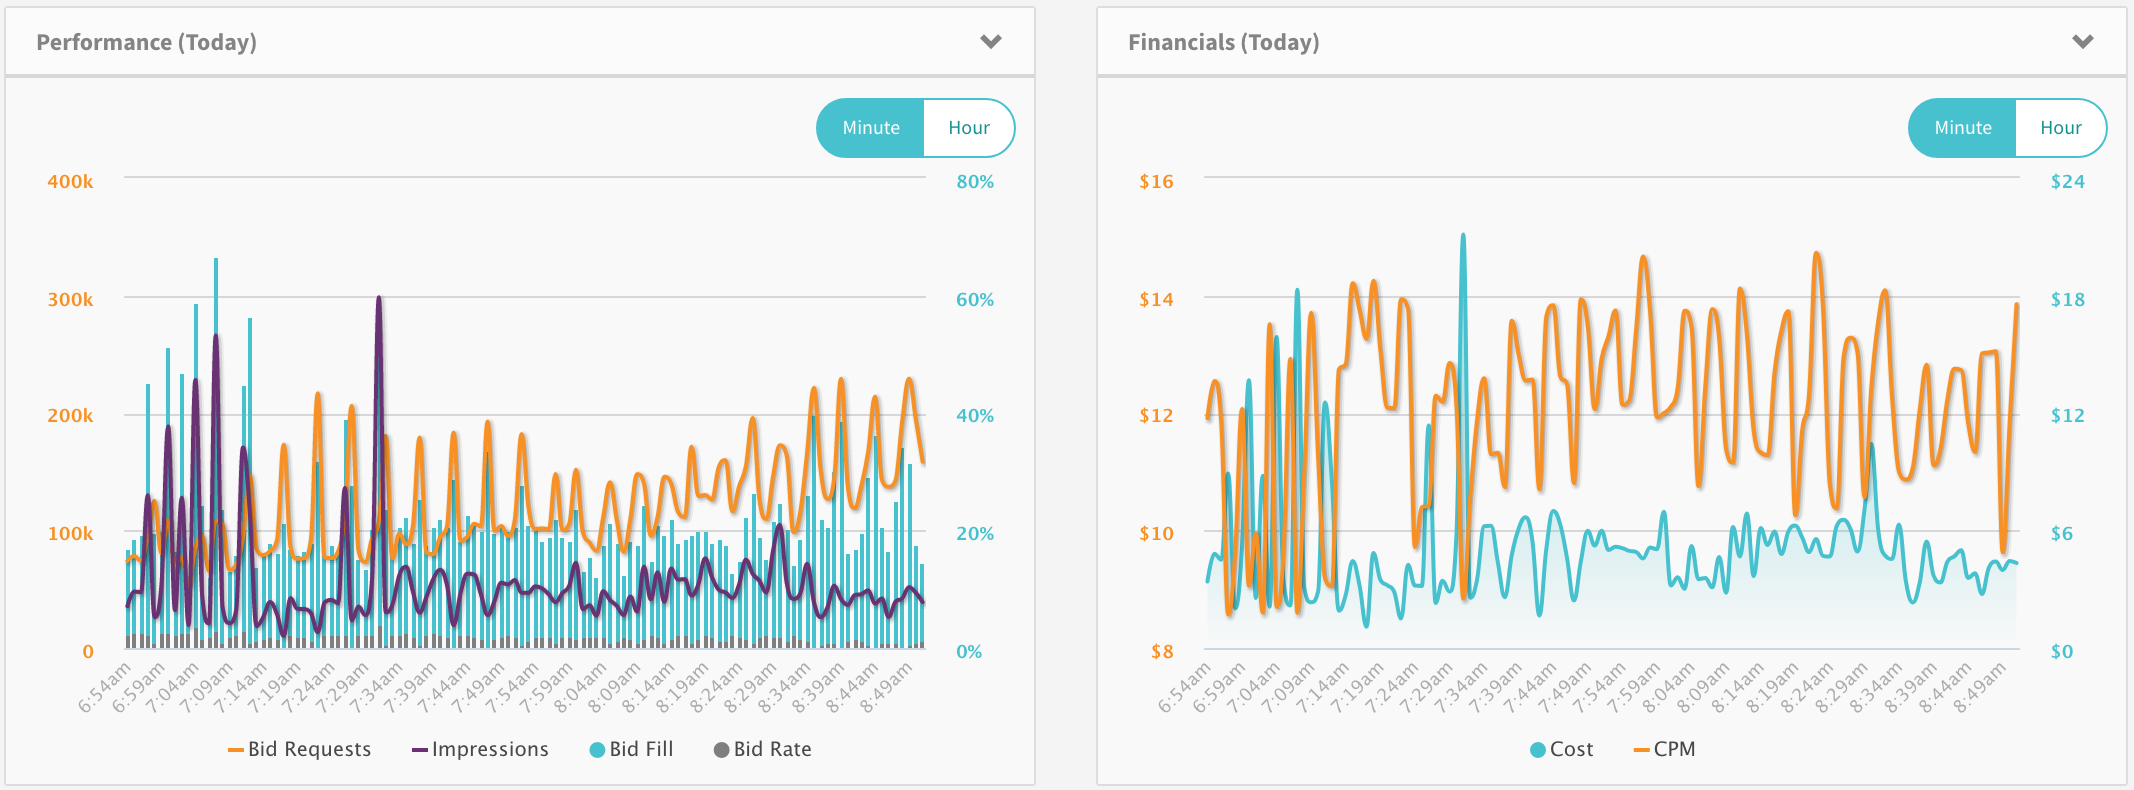
Minute & Hour Charts:
These charts show by minute Bid Requests, Impressions, Bid Fill, and Bid Rate for all the bidder's activity on SpringServe. The financials graphs show the average CPM of the bidder's price reduced bids as well as the total cost by minute. Both graph's can be toggled to 'Hour' in order to look at this data hourly for the day.
Top Publishers:
The Top 10 Publishers table is a fast way to see the top publishers you are transacting with on the SpringServe platform. This gives you a quick look at your daily performance with each of these publishers, and an easy way to navigate to them for a more granular look at performance.
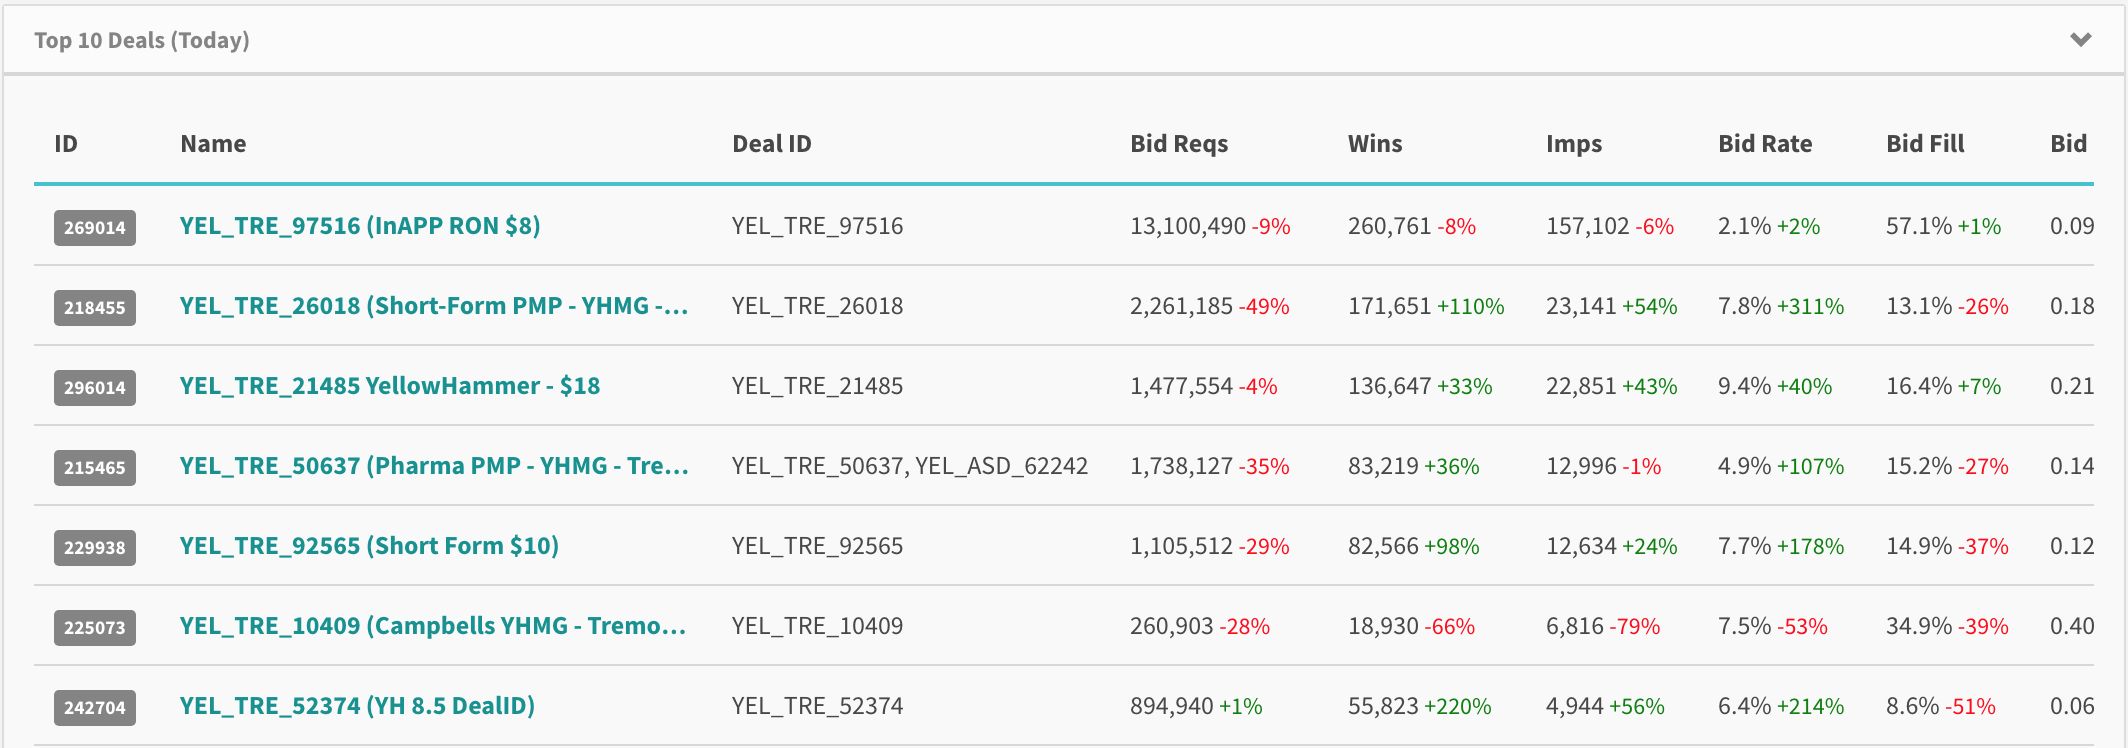
Top Deals:
The Top 10 Deals tables shows the deals you are buying the most inventory from on SpringServe. This shows daily performance for each deal as well as the Deal ID.