Reach & Frequency Reporting is now available in SpringServe by turning on the Reach & Frequency Reporting beta feature. With this feature, clients have the ability to run reports that show metrics the number of users they reach (namely the Reach) and how often they reach these users (namely Frequency) over time over supply & demand sources.
Reach & Frequency Reporting
Once this feature has been enabled for your account by your Account Manager, you will have the ability to run Frequency & Reach reports. On turning the beta feature for the account, users will see two new reporting templates available to run. These two reporting templates are called:
Reach Report
Frequency Report

The Mechanics of the Reach & Frequency Report Templates
This section explains the details of these two templates with emphasis on time parameters, dimensions, filters, metrics and interpreting the data.
Reach Report
The Reach report shows the details of the number of unique users, devices, ips and the impressions that have been served to these users. This report addresses custom use-cases where users can choose to run these metrics by custom time periods like Days, Weeks, Months or Cumulative.
Listed below are the specific considerations to be cognizant of when running this report:
Time Parameters:
Date Ranges: All Date Ranges available to existing Supply, Demand, Pod and Advertiser Domain Reports are available for this report.
The one difference is that if users select a custom time period, the max look back available to be selected is 365 days. Any time period beyond 365 days is ineligible for selection.
If users try to re-run a saved report for a time period that might exceed 365 days as of the time of running this report, then a message like the one shown in the screenshot below will be displayed

Intervals: All Intervals available to existing Supply, Demand, Pod and Advertiser Domain Reports are available for this report with the exception of hour.
Time Zone: This report can only be run in UTC.
Dimensions:
There are a few specific Demand, Supply Parameters are ineligible to be added to this report as Dimensions.
All Direct Connect, Programmatic Connect, Partner Segments Inventory (excluding Country) are ineligible to be added to this report as dimensions.
Filters:
The screenshot shows the filters container for a reach report with the Cadence filter pre-selected and the value of “All Days” pre-populated.
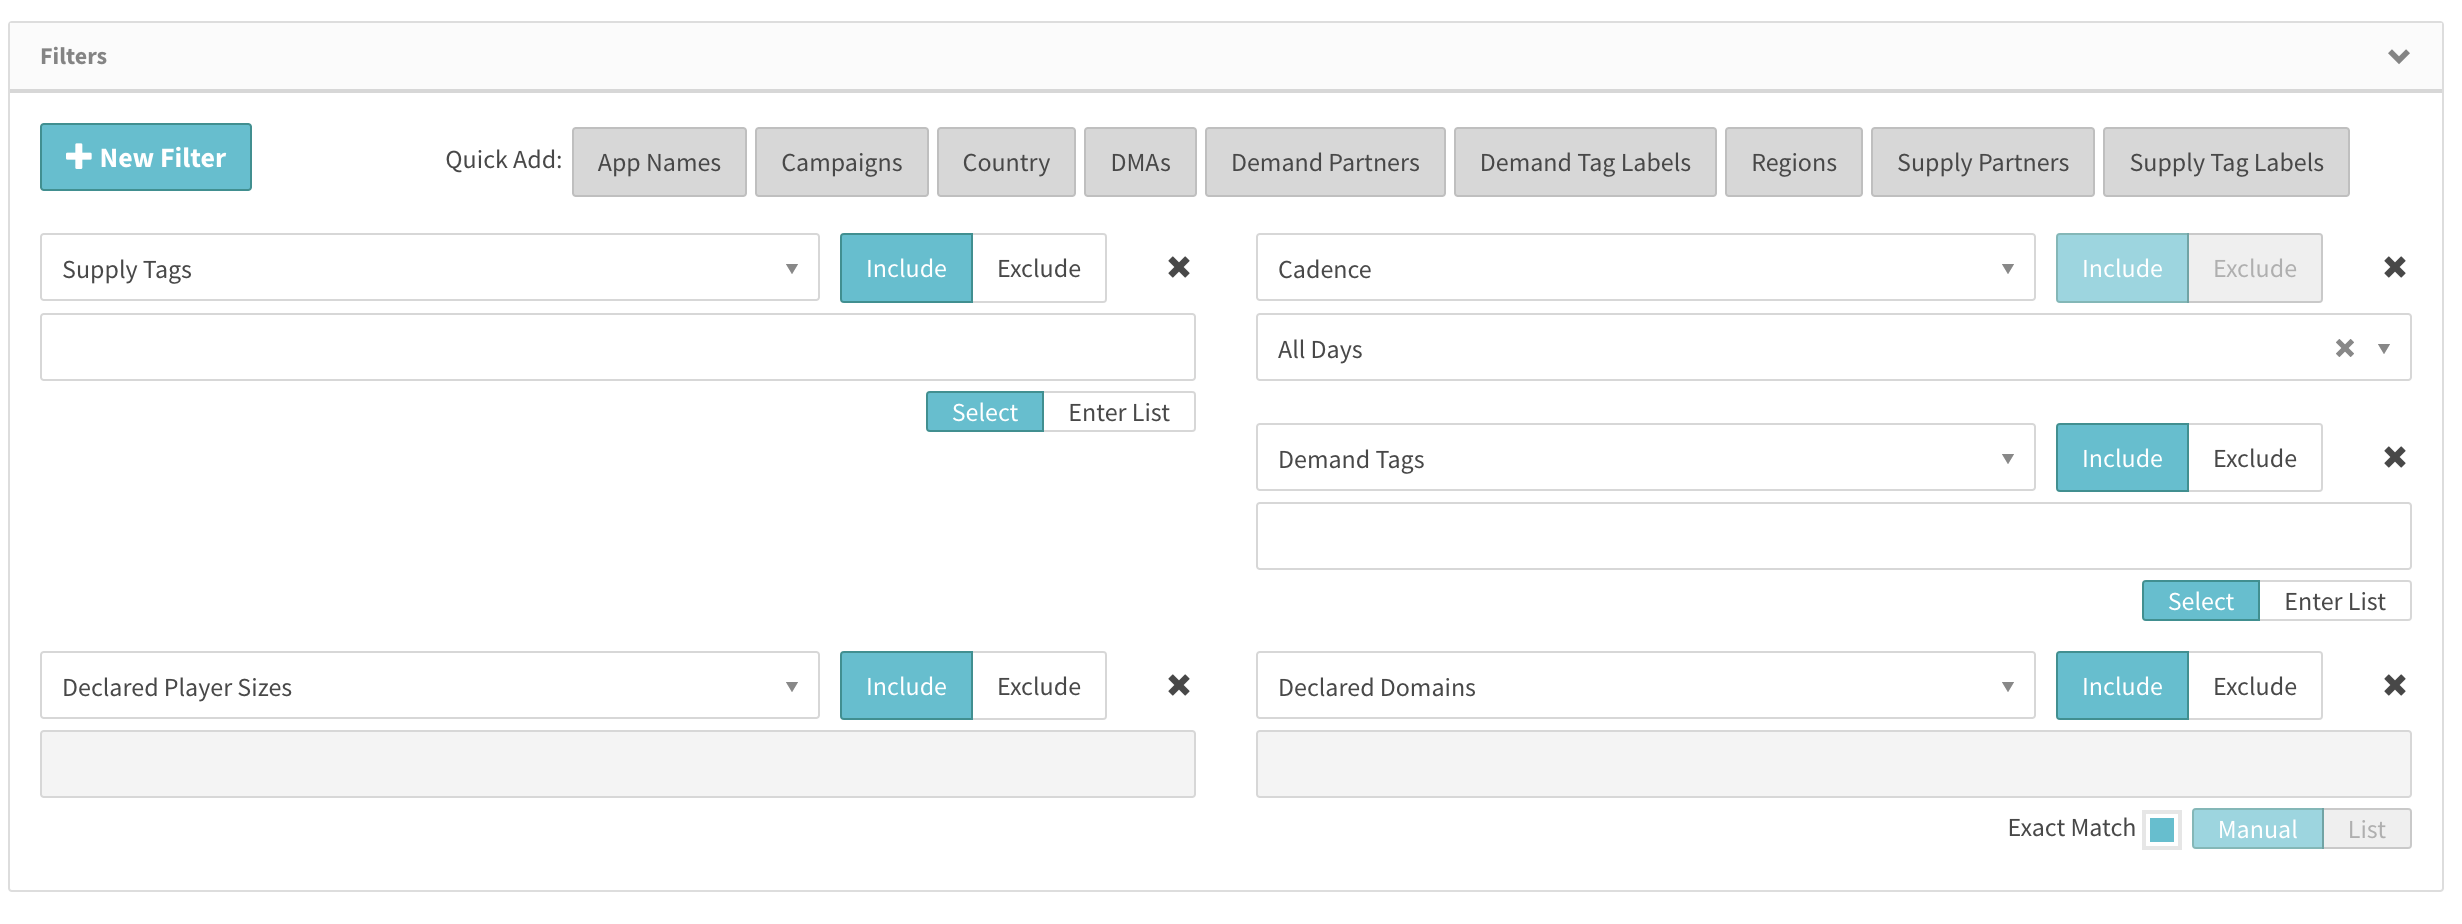
There are a few specific Demand, Supply Parameters are ineligible to be added to this report as Filters.
All Direct Connect, Programmatic Connect, Partner Segments Inventory (excluding Country) are ineligible to be added to this report as filters.
Metrics:
Attached below is a screenshot highlighting all the metrics available to be selected in this report with the ones in teal being the default selections.

Numbers:
Imps: This is the sum of Impressions aggregated over the the report parameters defined by time range, dimensions, filters, and date ranges.
Unique Users: Count of Unique Users aggregated over the the report parameters defined by time range, dimensions, filters, and date ranges.
Unique IPs: Count of Unique IP's aggregated over the the report parameters defined by time range, dimensions, filters, and date ranges.
Unique Devices: Count of Unique Devices aggregated over the the report parameters defined by time range, dimensions, filters, and date ranges.
Calculations:
User Reach: Impressions/Unique Users. This is indicative of the number of impressions seen by each user.
IP Reach: Impressions/Unique IP's. This is indicative of the number of impressions seen by each user IP.
Device Reach: Impressions/Unique Devices. This is indicative of the number of impressions served to each device.
Financials:
Note that the financial metrics available to this report do not have third party fees and thus the financial metrics available are Revenue, Media Cost and their derivative financial calculations.
Conditions
Users can set conditions on this report to return only those lines which meet those conditions. For example, you can run a report to return data filtered by a condition where unique users >= 10.
Users can use the Quick Add buttons to select a metric or click the +New Condition button and a dropdown will appear. Select your desired metric from the dropdown and set the condition.
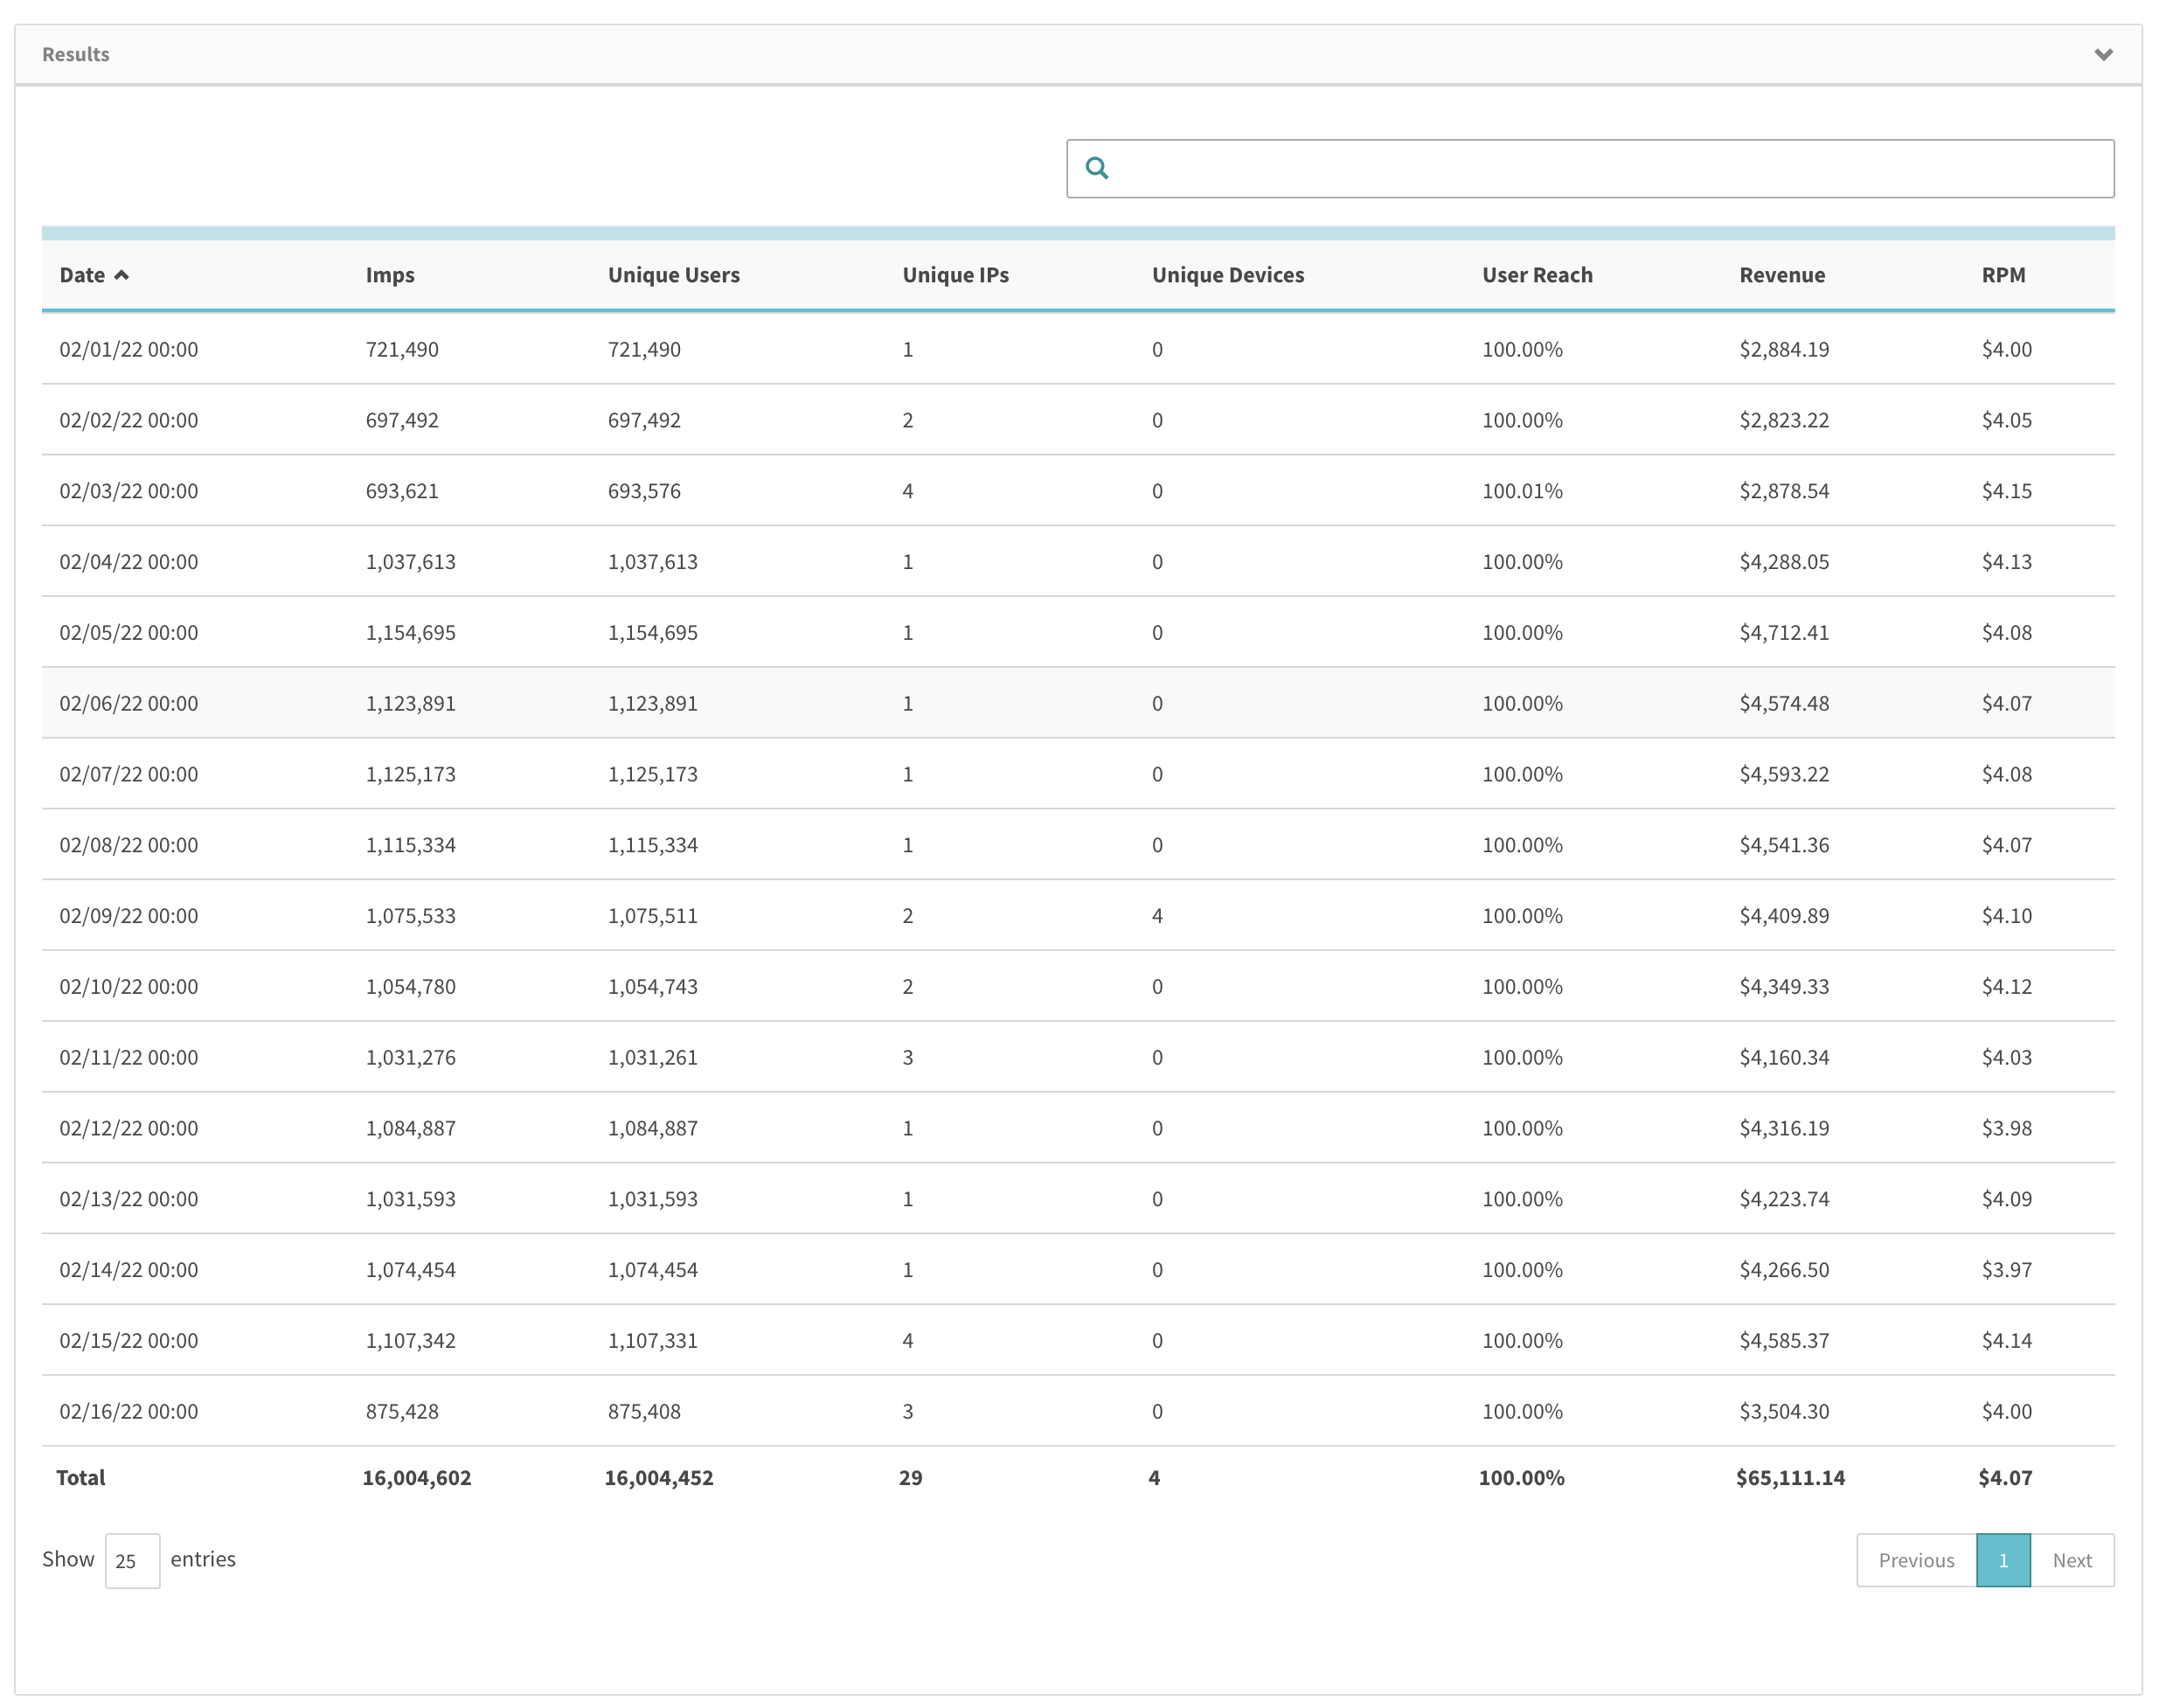
Below is a screenshot showing the first page of a results container for a report run on test data for the last month with the data broken out by day.
Frequency Report
The Frequency Report is almost entirely similar to the reach report with one key difference. All the mechanics detailed in the above section are applicable to this report and thus this section will highlight only the difference between this report and the reach report.
Time Parameters:
Dimensions:
Cadence is a set of pre-defined intervals for users who want to run these reports by the pre-defined Cadence Intervals. All possible values of the cadence intervals are displayed in the screenshot in the next section.
Interpreting Cadence
The screenshot below shows all applicable values for Cadence. Note that the values for cadence displayed will be dependent on the data range selected.
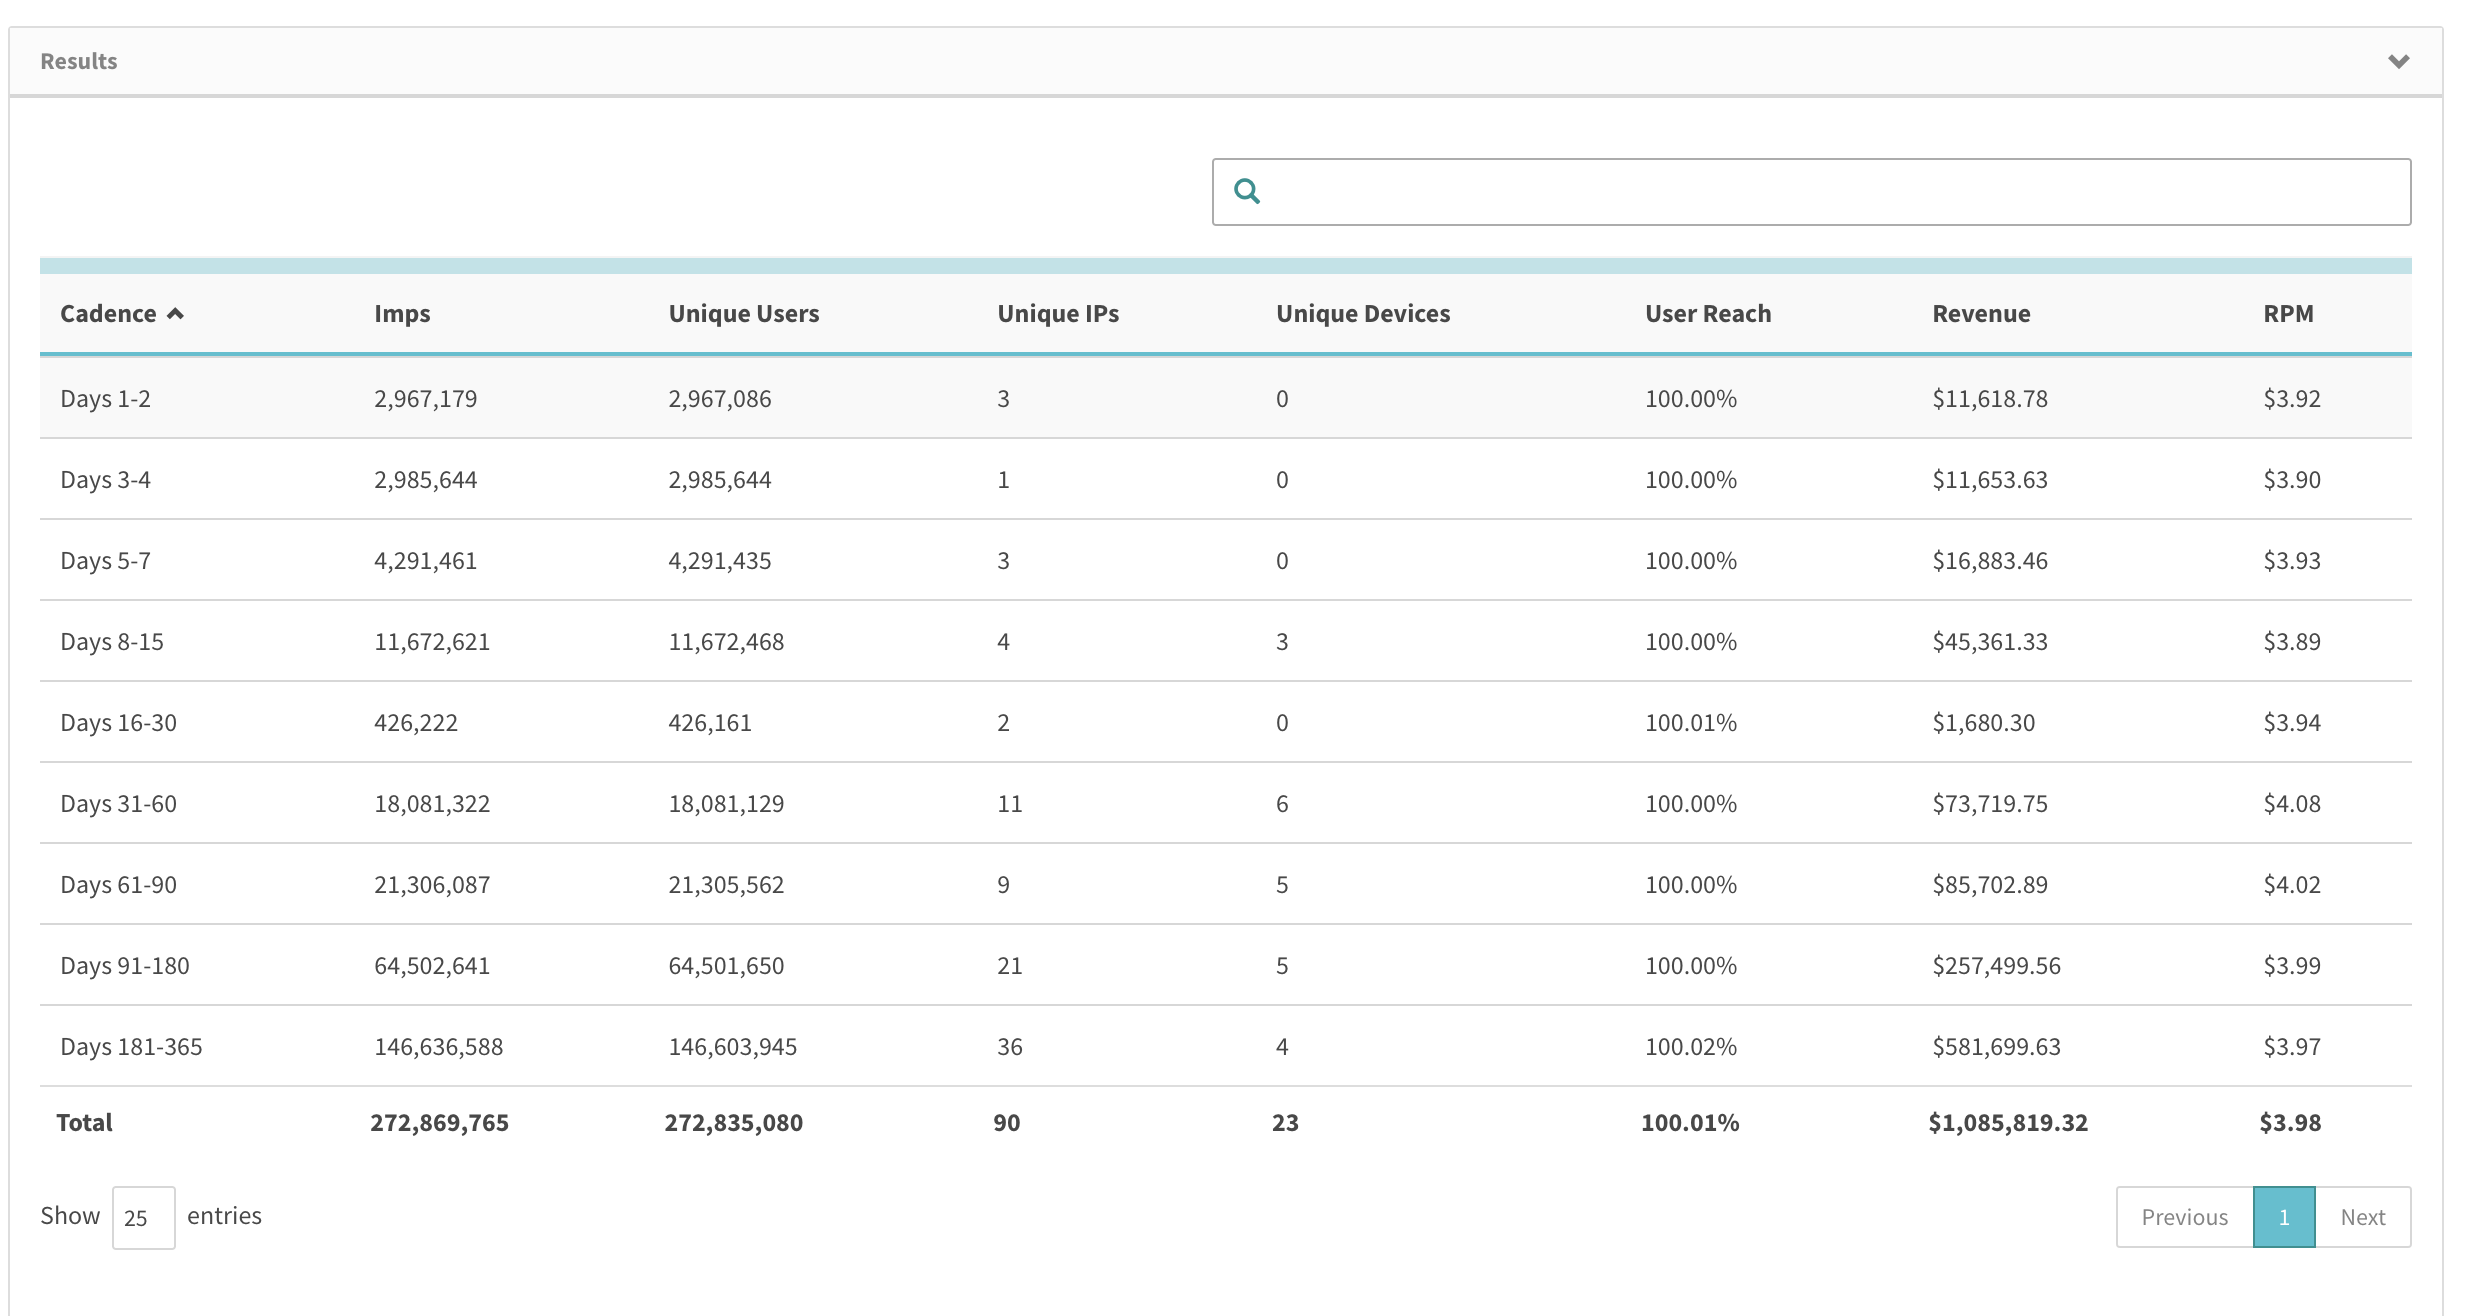
Note that “Days 1-2” implies that the metrics are being displayed for the current day and two days ago. “Days 3-4” implies that the metrics are being displayed for the time period from three days and including 4 days ago. Note that the lower and upper bounds for each cadence interval are inclusive, which means that Days 1-2 is inclusive of data up to 2 days ago from the end date of the date range selected.
To enunciate this logic, consider an example report that a user runs the frequency report for the last 30 days on March 30th at noon UTC.
In this case, the date range considered for this report will be March 30th and then we will count 30 days back from March 30th, which for the sake of this example will be March 1st.
Secondly, the values displayed in the cadence will be limited to the date range selected.
In this case, the values displayed will be such that the lower bound of the cadence interval can not exceed the date range. Thus, since Days 31-60 falls outside the 30 day date range, this and all following cadences will not be displayed in this report.
Here is an output for the report parameters defined above:
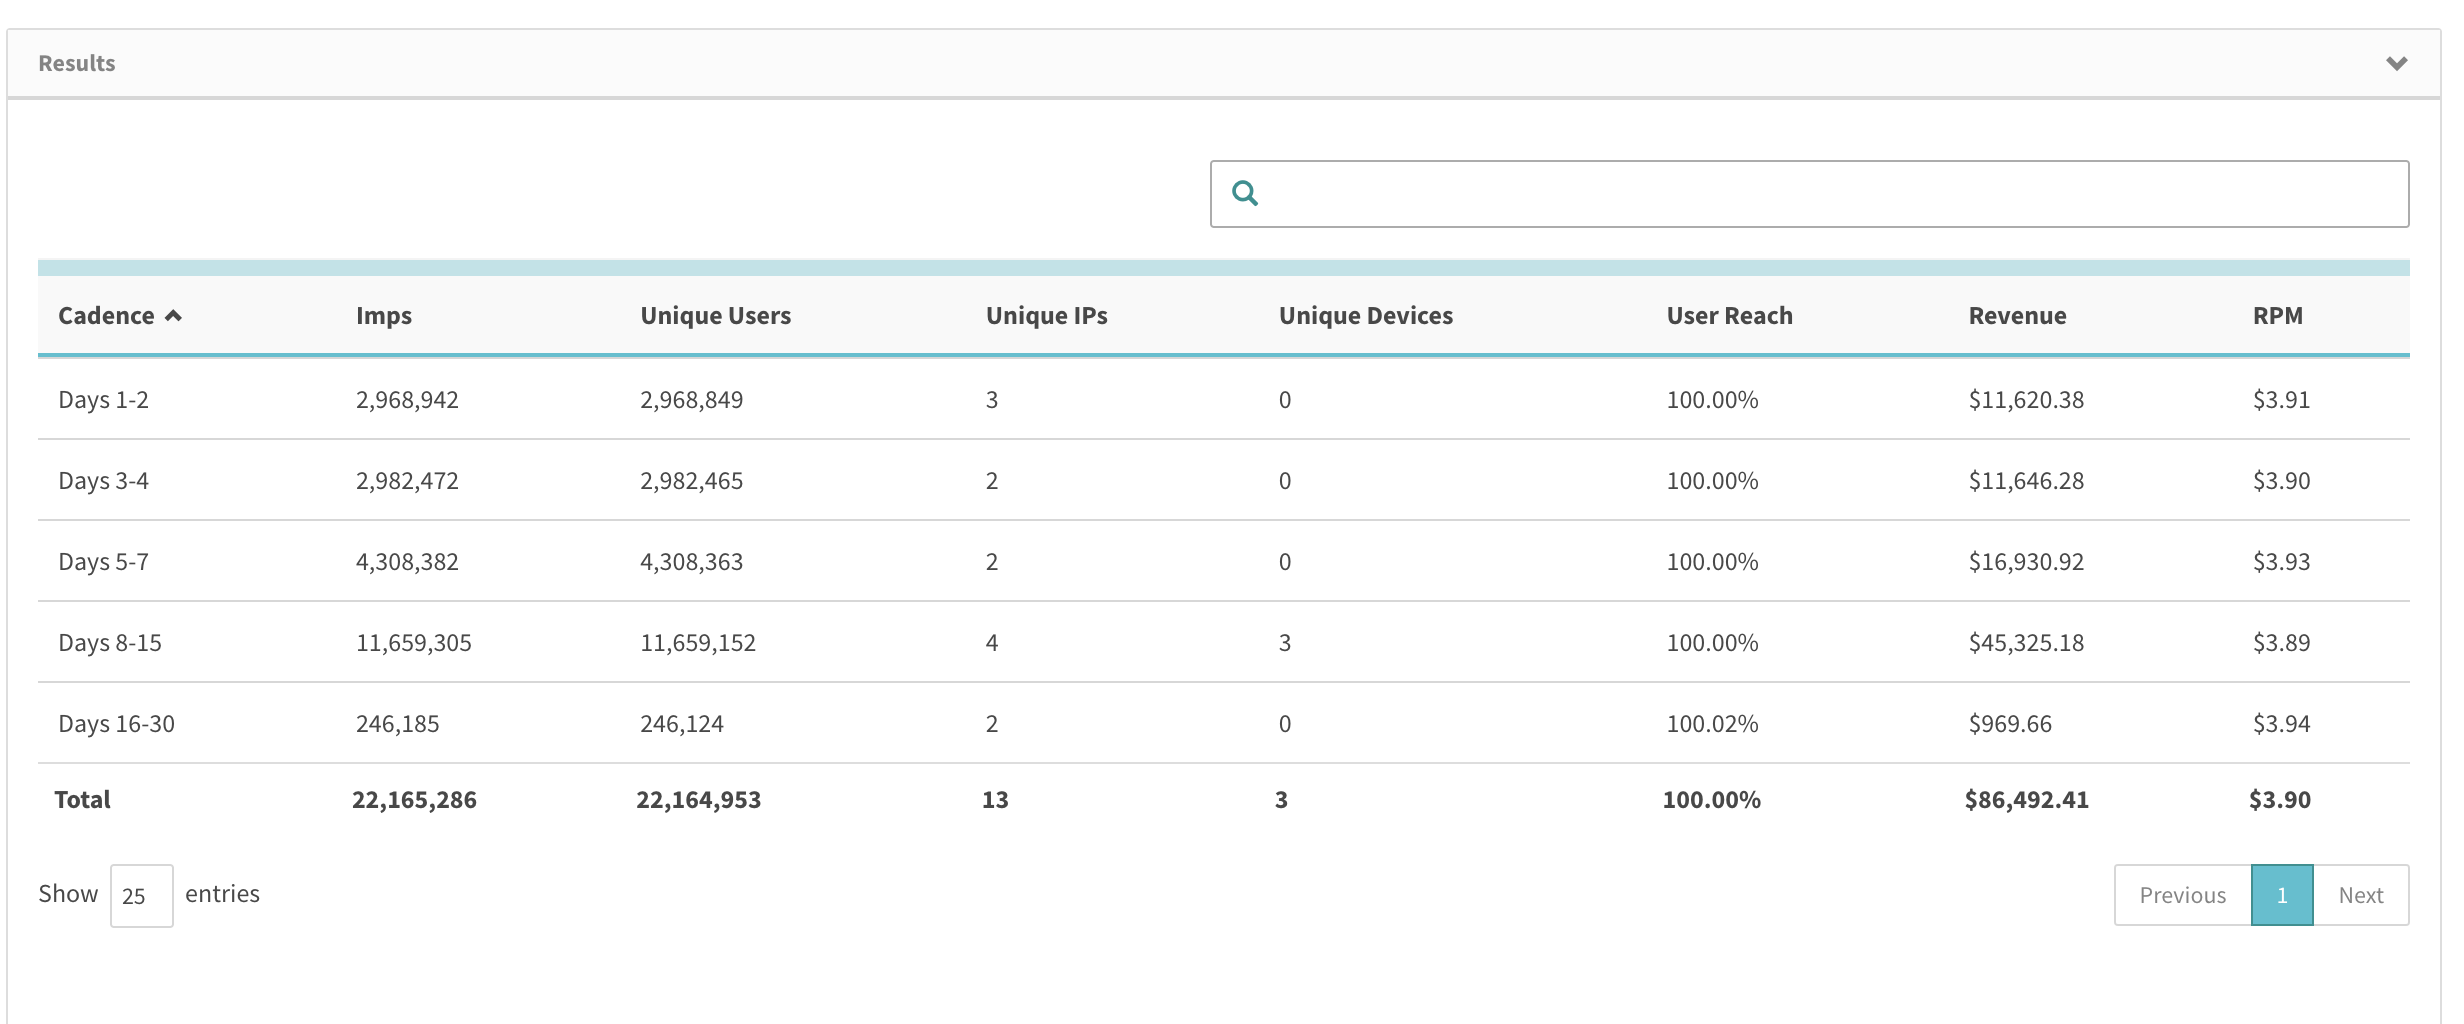
Days 1-2 is limited to and including March 30th - 29th
Days 3-4 is limited to and including March 28th - 27th
Days 5-7 is limited to and including March 26th - 24th
Days 8-15 is limited to and including March 23rd - 16th
Days 16-30 is limited to and including March 15th - 1st
If users run this report for a custom date range in the past, this logic still holds true. So, consider that a user runs a report for the month of January 2022 but runs this on March 30th at noon UTC, then these cadence intervals above will be run but the interpretation of the cadence interval in this report will be thus:
Days 1-2 is limited to and including Jan 31st - 30th
Days 3-4 is limited to and including Jan 29th - 28th
Days 5-7 is limited to and including Jan 27th - 25th
Days 8-15 is limited to and including Jan 24th - 17th
Days 16-30 is limited to and including Jan 16th - Jan 2snd
Days 31-60 is limited to and including only Jan 1st
Running Frequency & Reach Reports
When users run either of these reports, a modal will appear that displays a large Frequency & Reach report Modal with the following details:
Modal Title: Large Frequency & Reach Report
Text: This report is very large and will take over 2 minutes to run. You will be able to view it at the Download Reports page when it is complete. It will continue to be processed if you navigate away from this page.
Additionally, users can choose to add a name to this report.
The main thing to note is that due to the volume of data that needs to be processed to run these reports, these reports have a data lag of 8 hours and they will almost always take more than 2 minutes to run. Please note that there is a note highlighting this specifically in the results container while this report is being processed.

Users must also be cognizant of the fact that adding more incremental parameters to this report will increase the complexity of the queries used to process the data thereby increasing the processing time needed to run these reports.
Frequency Reports Edge-Case
Consider a Frequency report and reach report run for a custom date range of 03/29/21 00:00 - 03/29/22 23:59
The Reach report will show data like this for the last day:

And if you correlate this data with the Unknown_interval shown in the frequency report, these numbers will match.
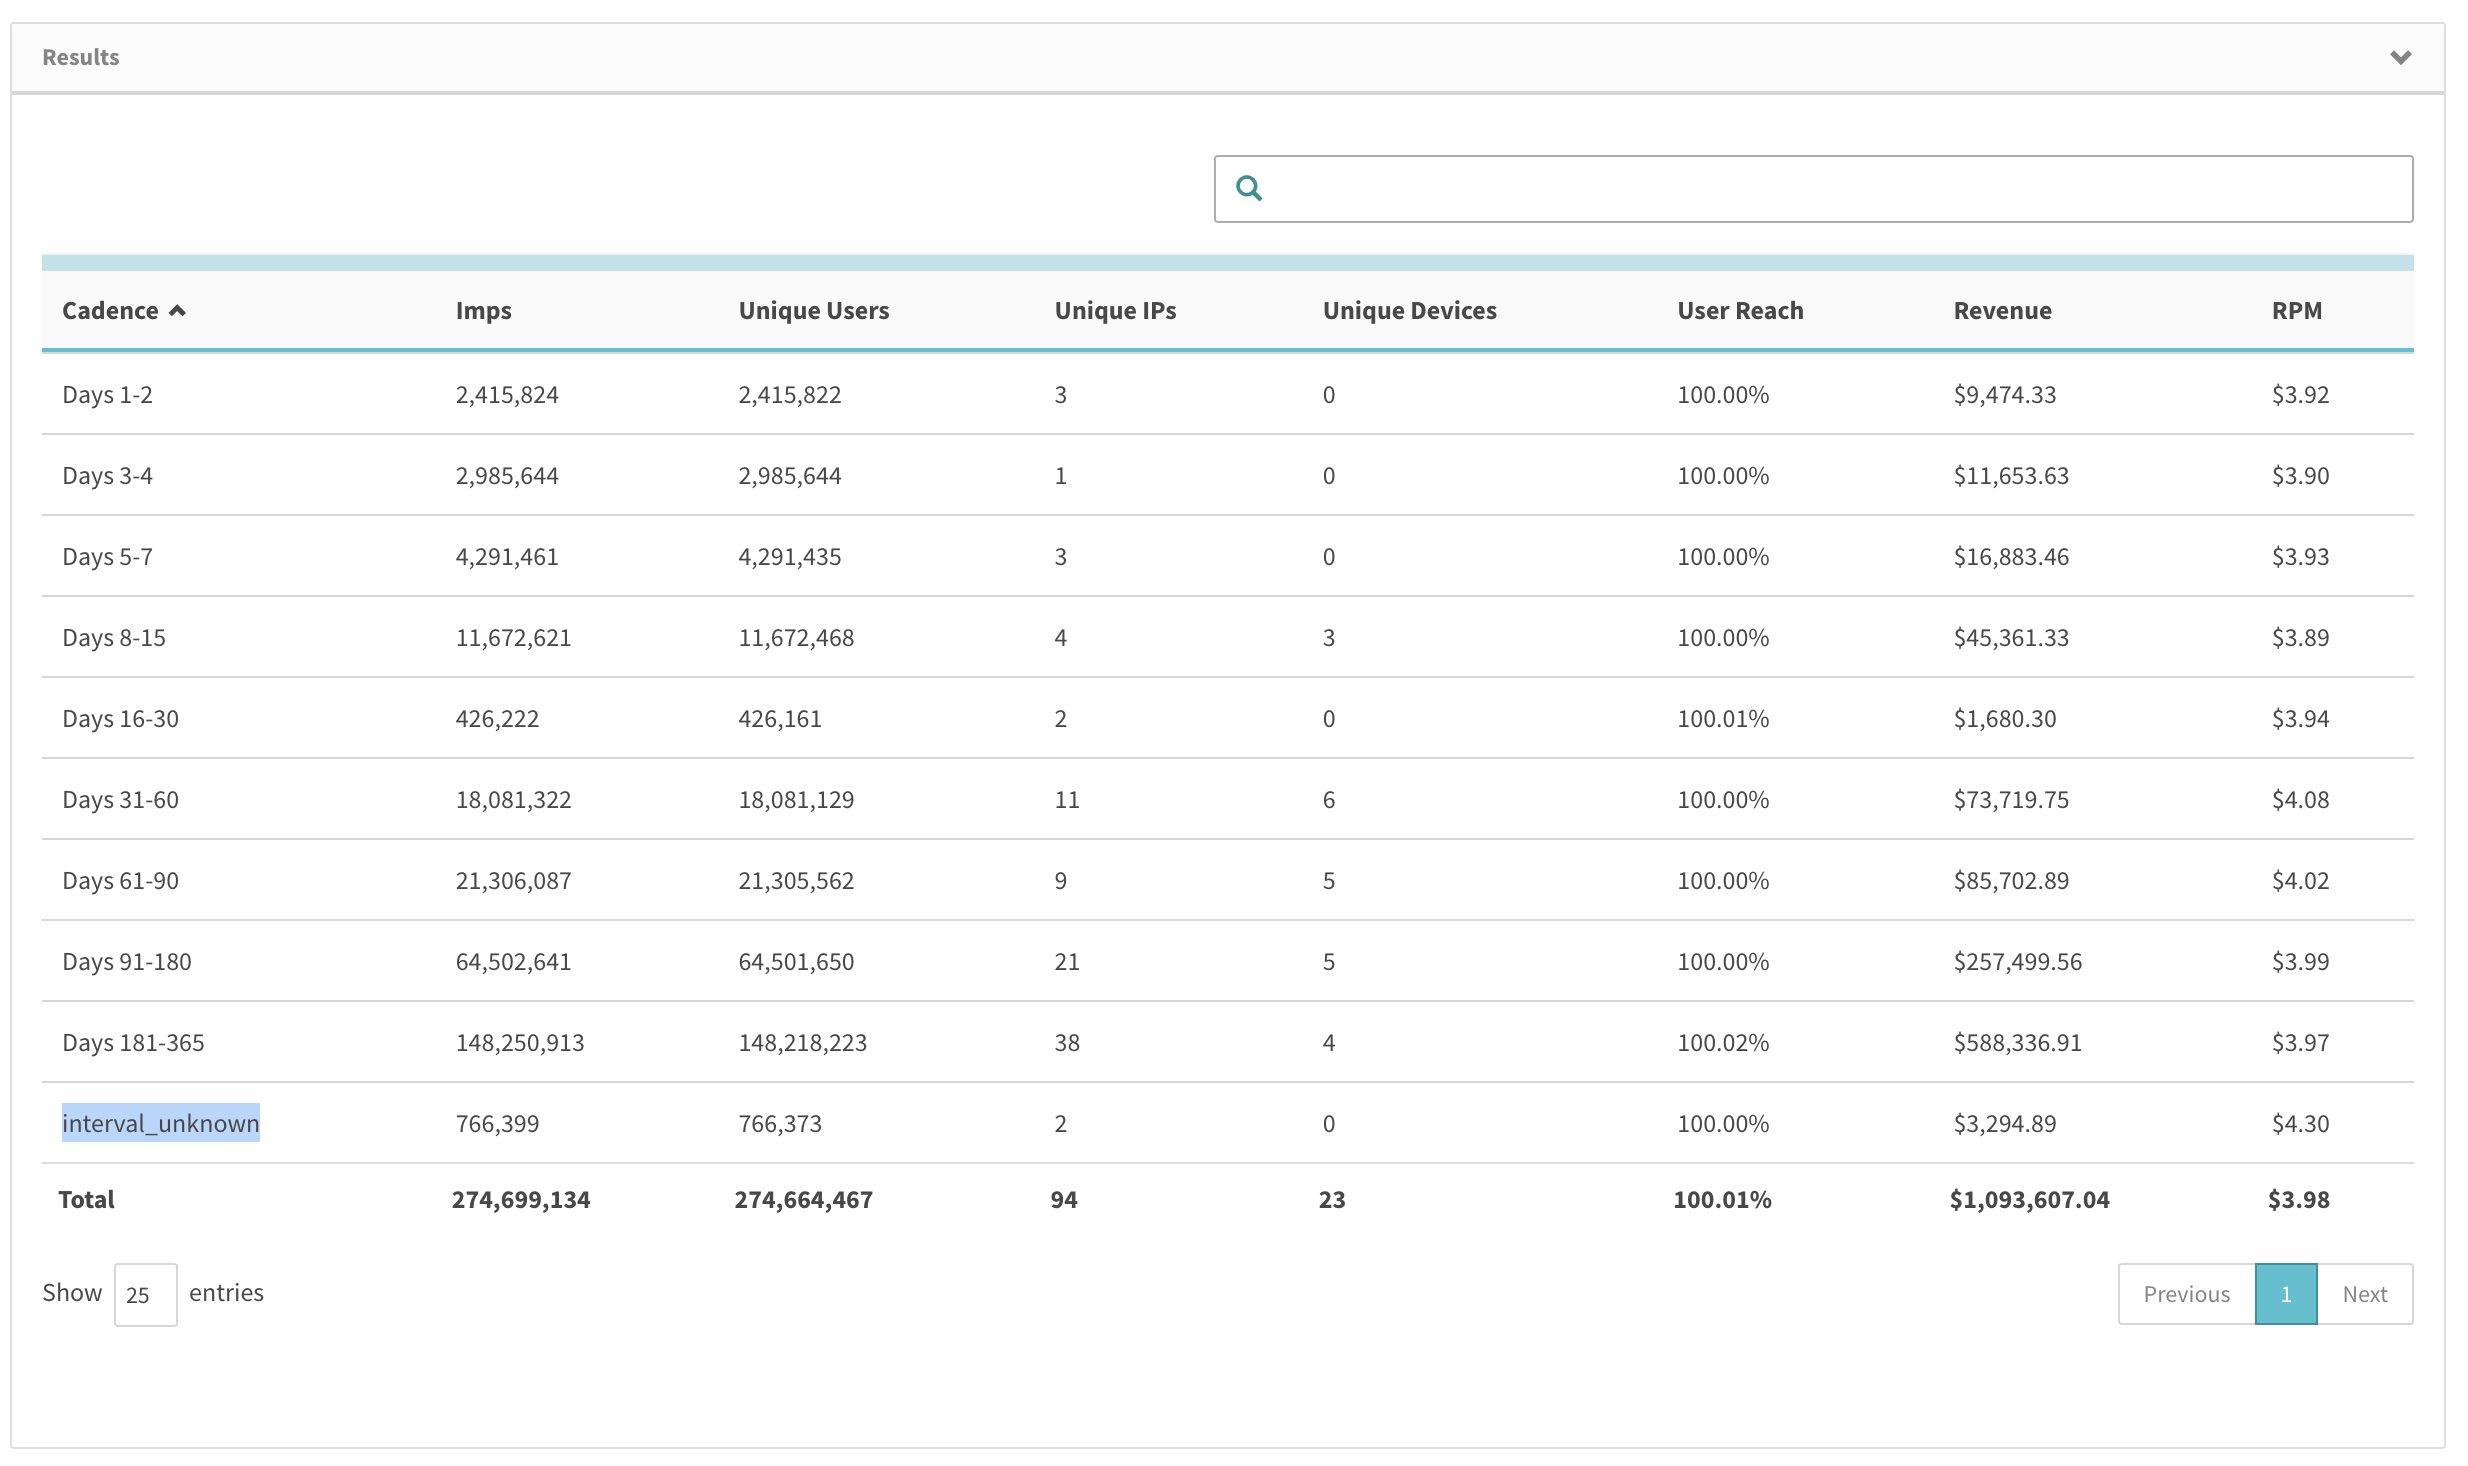
To enunciate this data, 365 days back in the UI is 03/29/21 00:00 - 03/29/22 23:59 since the start date of 03/29/21 00:00 falls out of the 365 days before 03/29/22 23:59, it falls into interval unknown. To explain it another way, it falls out of the cadence intervals but it's in the start and end dates and thus, we report on it.
Running Frequency & Reach Reports via the API
These reports are available to be run via the REST API. Here are the conditions to be aware of while running these reports via the REST API:
Start date and End date are required.
Start date cannot be before 365 days ago
Timezone must be UTC
Interval must be cumulative when cadence is a dimension
Interval cannot be Hour when all_days cadence filter
Require async when using API since reports generally take longer than 2 mins.
Here’s an example API Call in our test environment with the Auth token hidden for running these reports after users have received a valid Authorization token.
curl --location --request POST 'https://staging-admin-console.springserve.com/api/v0/report' \
--header 'Content-Type: application/json' \
--header 'Authorization: ________________' \
--data-raw '{
    "interval":"day",
    "timezone":"UTC",
    "start_date":"2021-08-26",
    "end_date": "2022-01-01",
    "demand_tag_ids":[24275],
    "async":true
}' |
It is important to note that these reports will not work in the API when the flag "async":true is not set in the CURL call.


